Entity Relationship Diagram
Entity Relationship Diagram
An Entity–relationship model (ER model) describes the structure of a database with the help of a diagram, which is known as Entity Relationship Diagram (ER Diagram). An ER model is a design or blueprint of a database that can later be implemented as a database. The main components of E-R model are: entity set and relationship set.
- ER model stands for an Entity-Relationship model. It is a high-level data model. This model is used to define the data elements and relationship for a specified system.
- It develops a conceptual design for the database. It also develops a very simple and easy to design view of data.
- In ER modeling, the database structure is portrayed as a diagram called an entity-relationship diagram.
What is an Entity Relationship Diagram (ER Diagram)?
An ER diagram shows the relationship among entity sets. An entity set is a group of similar entities and these entities can have attributes. In terms of DBMS, an entity is a table or attribute of a table in database, so by showing relationship among tables and their attributes, ER diagram shows the complete logical structure of a database. Lets have a look at a simple ER diagram to understand this concept.
A simple ER Diagram:
In the following diagram we have two entities Student and College and their relationship. The relationship between Student and College is many to one as a college can have many students however a student cannot study in multiple colleges at the same time. Student entity has attributes such as Stu_Id, Stu_Name & Stu_Addr and College entity has attributes such as Col_ID & Col_Name.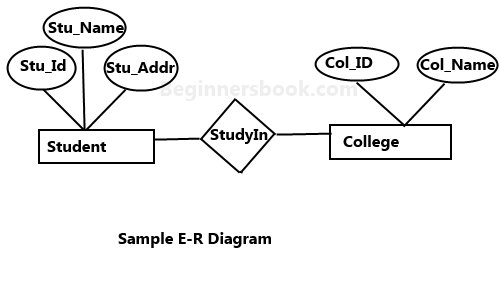
Rectangle: Represents Entity sets.
Ellipses: Attributes
Diamonds: Relationship Set
Lines: They link attributes to Entity Sets and Entity sets to Relationship Set
Double Ellipses: Multivalued Attributes
Dashed Ellipses: Derived Attributes
Double Rectangles: Weak Entity Sets
Double Lines: Total participation of an entity in a relationship set
Components of a ER Diagram

As shown in the above diagram, an ER diagram has three main components:
1. Entity
2. Attribute
3. Relationship
1. Entity
An entity is an object or component of data. An entity is represented as rectangle in an ER diagram.
For example: In the following ER diagram we have two entities Student and College and these two entities have many to one relationship as many students study in a single college. We will read more about relationships later, for now focus on entities.

Weak Entity:
An entity that cannot be uniquely identified by its own attributes and relies on the relationship with other entity is called weak entity. The weak entity is represented by a double rectangle. For example – a bank account cannot be uniquely identified without knowing the bank to which the account belongs, so bank account is a weak entity.

2. Attribute
An attribute describes the property of an entity. An attribute is represented as Oval in an ER diagram. There are four types of attributes:
- Key attribute
- Composite attribute
- Multivalued attribute
- Derived attribute
- Simple attribute
- Single attribute
- Stored attribute
Key attribute:
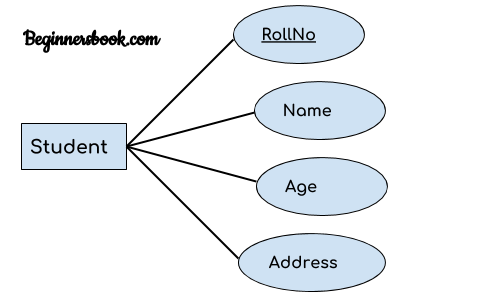
A key attribute can uniquely identify an entity from an entity set. For example, student roll number can uniquely identify a student from a set of students. Key attribute is represented by oval same as other attributes however the text of key attribute is underlined.
Composite attribute:
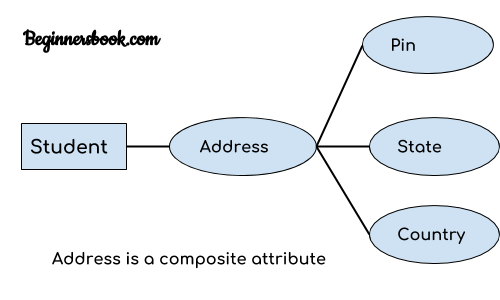
An attribute that is a combination of other attributes is known as composite attribute. For example, In student entity, the student address is a composite attribute as an address is composed of other attributes such as pin code, state, country.
Multivalued attribute:
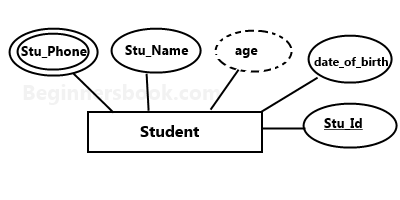
An attribute that can hold multiple values is known as multivalued attribute. It is represented with double ovals in an ER Diagram. For example – A person can have more than one phone numbers so the phone number attribute is multivalued.
Derived attribute:
A derived attribute is one whose value is dynamic and derived from another attribute. It is represented by dashed oval in an ER Diagram. For example – Person age is a derived attribute as it changes over time and can be derived from another attribute (Date of birth).
Single attribute:
Most attributes have a single value for particular entity such attributes are called single attributes . For example - age is a single value attribute of a person .
Stored attribute :
All attribute whose value is stored in the database and we use it to make a derived attribute or as it is .
Simple attribute:
Attributes that are not divisible are called simple or atomic attributes .
E-R diagram with multivalued and derived attributes:
3. Relationship
A relationship is represented by diamond shape in ER diagram, it shows the relationship among entities. There are four types of relationships:
1. One to One
2. One to Many
3. Many to One
4. Many to Many
1. One to One Relationship
When a single instance of an entity is associated with a single instance of another entity then it is called one to one relationship. For example, a person has only one passport and a passport is given to one person.

2. One to Many Relationship
When a single instance of an entity is associated with more than one instances of another entity then it is called one to many relationship. For example – a customer can place many orders but a order cannot be placed by many customers.

3. Many to One Relationship
When more than one instances of an entity is associated with a single instance of another entity then it is called many to one relationship. For example – many students can study in a single college but a student cannot study in many colleges at the same time.

4. Many to Many Relationship
When more than one instances of an entity is associated with more than one instances of another entity then it is called many to many relationship. For example, a can be assigned to many projects and a project can be assigned to many students.
Total Participation of an Entity set
A Total participation of an entity set represents that each entity in entity set must have at least one relationship in a relationship set. For example: In the below diagram each college must have at-least one associated Student.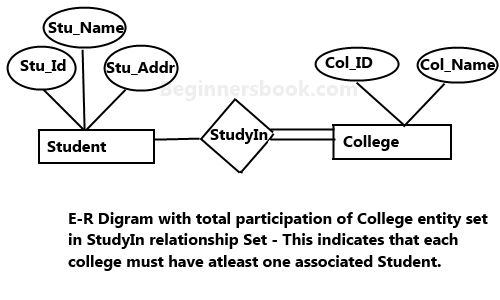
Example - Flight ER Diagram
The flight database stores details about an airline’s fleet, flights, and seat bookings. Again, it’s a hugely simplified version of what a real airline would use, but the principles are the same.
Consider the following requirements list:
The airline has one or more airplanes.
An airplane has a model number, a unique registration number, and the capacity to take one or more passengers.
An airplane flight has a unique flight number, a departure airport, a destination airport, a departure date and time, and an arrival date and time.
Each flight is carried out by a single airplane.
A passenger has given names, a surname, and a unique email address.
A passenger can book a seat on a flight.
An
Airplaneis uniquely identified by itsRegistrationNumber, so we use this as the primary key.A
Flightis uniquely identified by itsFlightNumber, so we use the flight number as the primary key. The departure and destination airports are captured in theFromandToattributes, and we have separate attributes for the departure and arrival date and time.Because no two passengers will share an email address, we can use the
EmailAddressas the primary key for thePassengerentity.An airplane can be involved in any number of flights, while each flight uses exactly one airplane, so the
Fliesrelationship between theAirplaneandFlightrelationships has cardinality 1:N; because a flight cannot exist without an airplane, theFlightentity participates totally in this relationship.A passenger can book any number of flights, while a flight can be booked by any number of passengers. As discussed earlier in Intermediate Entities,” we could specify an M:N
Booksrelationship between thePassengerandFlightrelationship, but considering the issue more carefully shows that there is a hidden entity here: the booking itself. We capture this by creating the intermediate entityBookingand 1:N relationships between it and thePassengerandFlightentities. Identifying such entities allows us to get a better picture of the requirements. Note that even if we didn’t notice this hidden entity, it would come out as part of the ER-to-tables mapping process we’ll describe next in Using the Entity Relationship Model.”
Company ER Diagram
ER diagram of Company has the following description :
- Company has several departments.
- Each department may have several Location.
- Departments are identified by a name, D_no, Location.
- A Manager control a particular department.
- Each department is associated with number of projects.
- Employees are identified by name, id, address, dob, dat e_of_joining.
- An employee works in only one department but can work on several project.
- We also keep track of number of hours worked by an employee on a single project.
- Each employee has dependent
- Dependent has D_name, Gender and relationship.
Entities and their Attributes
Employee Entity :
Attributes of Employee Entity are Name, Id, Address, Gender, Dob and Doj.
Id is Primary Key for Employee Entity.
Department Entity :
Attributes of Department Entity are D_no, Name and Location.
D_no is Primary Key for Department Entity
Project Entity :
Attributes of Project Entity are P_No, Name and Location.
P_No is Primary Key for Project Entity.
Dependent Entity :
Attributes of Dependent Entity are D_no, Gender and relationship.
Employees works in Departments –
Many employee works in one Department but one employee can not work in many departments.
Manager controls a Department –
Employee works under the manager of the Department and the manager records the date of joining of employee in the department.
Department has many Projects –
One department has many projects but one project can not come under many departments.
Employee works on project –
One employee works on several projects and the number of hours worked by the employee on a single project is recorded.
Employee has dependents –
Each Employee has dependents. Each dependent is dependent of only one employee.


Comments
Post a Comment